Combating air pollution: cleaner air for Brixton
How can urban air quality be improved? An innovative Bosch solution is helping find the answer. It delivers a precise analysis of current and projected levels of pollutants — which can then be used to make targeted improvements to traffic flow and air quality. Our story takes us to the south of London.
Just like a weather forecast
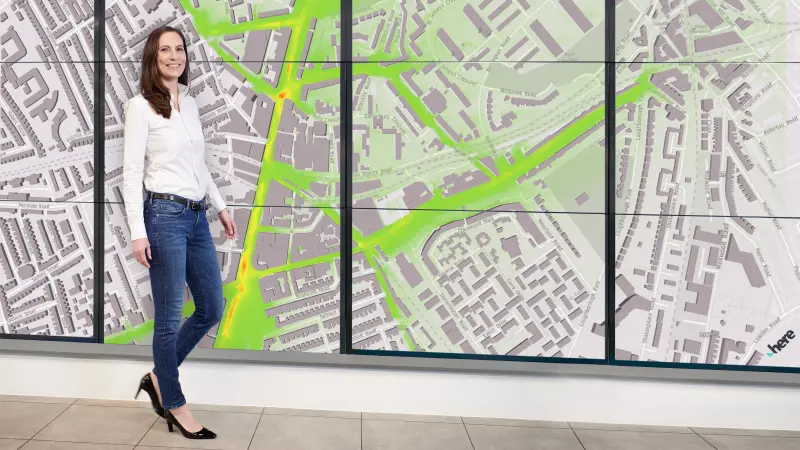
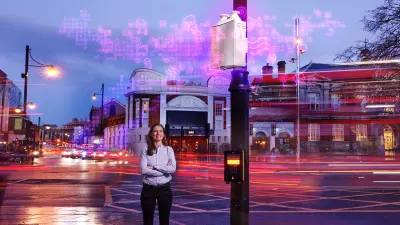
“Two degrees Celsius and light showers.” Confronted with a weather forecast like this, most people instinctively know what to do: dress warmly and don’t forget to take an umbrella. The sophisticated sensor system developed by Dr. Maria Martínez Prada and her team also generates forecasts. But in this case, their charts and graphs reveal more than just the overall weather situation. They also provide a battle plan against air pollution, and can contribute to a better quality of life in urban areas. While there’s generally no changing the weather, environmental pollution is certainly something that can be mitigated.
Take London: it’s a great city with a lot of flair — but it also has a major problem with nitrogen dioxide (NO₂) emissions. On Brixton Road, for example, a mainly two-lane street south of the River Thames, NO₂ levels regularly exceed the EU-wide limit of 40 micrograms per cubic meter. A partnership between Transport for London (TfL) and the Bosch Connectory, a development center for solutions relating to the internet of things, is seeking to change this with a service aimed at optimizing traffic flows to reduce air pollution. A key role here is played by an innovation that goes by the simple name of “air quality solution.”
Precise mapping is key to improved air quality
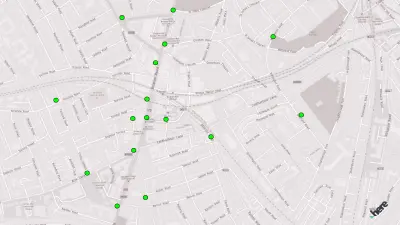
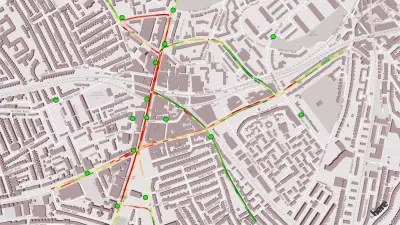
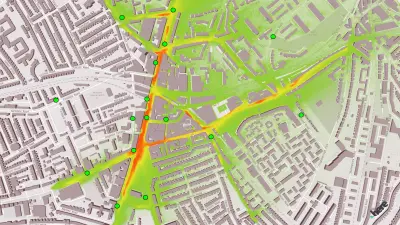
The technology being used in a roughly four square-kilometer area bordering Brixton Road is designed to analyze the pollution caused by traffic and to forecast how it will be dispersed. If measures to combat air pollution are to be effective, they need to be based on a sound understanding of what causes it, how it spreads, and how it changes during the course of the day.
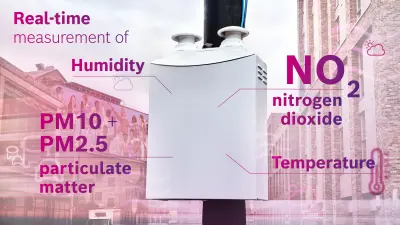
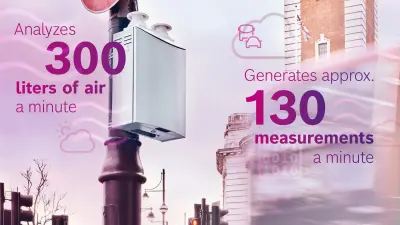
The cornerstones of the London project are 17 air quality monitoring boxes. Measuring 60 centimeters high and 40 centimeters across, they contain a range of sensors including various gas and particle sensors and sensors for humidity, temperature, and pressure. “The boxes measure levels of nitrogen dioxide and particulate matter, humidity, and ambient temperature, among other things,” says Martínez Prada, who has a PhD in sensor technology. The data is then uploaded to a Bosch cloud — the brains, as it were, of the air quality solution.

How the air quality solution records and processes data
Once in the cloud, this data is correlated with other data, such as traffic volume. As their name suggests, however, the air quality monitoring boxes only measure ambient air quality — in other words, the concentration of pollutants such as nitrogen oxides that are present in the air in the box’s vicinity. They don’t measure what individual cars emit. Particulates emitted by vehicles, for example, are not deposited equally everywhere.
Some adhere to the ground, while others are blown away by the wind or washed away by rain. The monitoring boxes thus do not record total vehicle emissions, but rather the proportion of them that remain in the air at heavily impacted locations.
Sources of data for AI
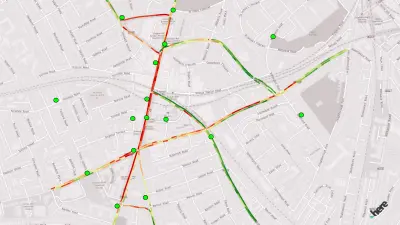
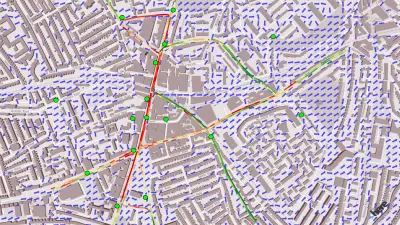
Since the boxes detect all airborne emissions regardless of where they originated, the air pollution cannot be traced back to specific sources. To be able to identify these sources nonetheless, further parameters are factored into the calculations performed in the cloud, such as data about traffic flow and congestion. This data is provided by Here Technologies, a geodata company in which Bosch holds a stake. Here gathers the data from sources such as onboard vehicle navigation systems, and supplies the data in anonymized form. In addition, TfL provides information on traffic-light phases and vehicle types. Bosch has a wealth of expertise about the powertrain technologies of diverse vehicles, and can use this information to model emissions levels. In addition, parameters such as satellite data on meteorological conditions and information from the municipal authorities on the topology of buildings are collected. In a dispersion simulation, the combined data are translated into charts and graphs.
To forecast pollution levels, an algorithm based on artificial intelligence is used. The algorithm was generated by means of machine learning and takes data collected by individual monitoring stations over the last two years as its starting point. On this basis, the algorithm can calculate the impact that specific weather conditions, rush-hour traffic, different days of the week, and major events can have on air quality levels in any given area. By combining empirical data and the measurements from the air quality measurement boxes, the AI can forecast what effect traffic-related emissions will have on air quality in certain weather conditions. This knowledge can be used to intervene in traffic management well in advance.
A roughly 20%
reduction in pollution levels: this is how much was achieved in comparable projects by means of traffic management.
Achieving tangible improvements with the air quality solution

Pointing to numbers displayed on a big screen, Martínez Prada explains how this works: “This data tells us precisely how much traffic is contributing to local air pollution. We can do this by comparing emissions during a weekday rush hour with those on the weekend, for example, or by analyzing the impact of bad weather on particulate levels. The data will even tell us what impact a light east wind will have on air quality.”
These precise forecasts are the product of a wealth of multidisciplinary expertise at Bosch: the company possesses not only vast knowledge in sensor technology but also decades of experience in dealing with vehicle emissions. Moreover, it knows how to use AI to process data. But how will all this benefit the people on Brixton Road? This is where TfL plays a key role. A service created on the basis of the air quality solution can be used to test whether, and to what extent, measures such as rerouting traffic and modifying traffic-light phases can help improve traffic flow, and thus air quality.
London is only the beginning
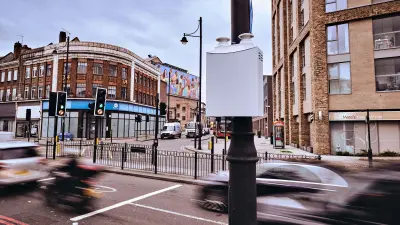
The precise monitoring solution can also be used at specific locations such as schools and day-care centers. Real-time monitoring and forecasts of air pollution can allow outdoor activities such as physical education classes to be scheduled better. It also opens up new opportunities for additional applications of this technology in the growing market for smart campuses — so-called because they make use of intelligent, connected solutions. For example, the statistics provided by Bosch monitoring boxes could be used to control smart ventilation systems. If results show that summer air quality is better outdoors than indoors, windows can be opened automatically and the energy-intensive ventilation system switched off. This reduces energy consumption and, consequently, CO₂ emissions.
Profile

Dr. Maria Martínez Prada
Sub-project leader at Bosch Powertrain Solutions
As a team, we’ve developed an innovative technology that helps us get a better handle on a global problem: air pollution in major cities. That makes me feel proud.
Dr. Maria Martínez Prada became part of the team developing air quality solutions in March 2019. Since then, she has poured her heart and soul into the development of air quality monitoring systems. Previously, she was team leader for chemical sensor research at Bosch in Renningen, Germany. Her hobbies include playing tennis.
